How To Read Crypto Price Charts

For cryptocurrency traders, understanding crypto price charts is essential for assessing market price movements and trends. The ability to read and interpret price charts is an integral part of technical analysis in trading, enabling traders to make informed trading decisions.
To beginners, price charts may seem complex and intimidating. However, with a little guidance and practice, anyone can read price charts like a pro. This guide will simplify crypto price charts and how to read them.
How To Read A Crypto Price Chart
Price: Y-Axis
The price of a trading pair is read on the vertical or y-axis.
Base Currency And Quote Currency
The trading pair’s price is denoted in the base currency and quote currency.
The base currency is the first currency in the pair (ETH in ETH/USDT), while the quote currency is the second currency in the pair (USDT in ETH/USDT).
The base currency is typically a cryptocurrency (ETH) and the quote currency is denoted in fiat currency (USD) or stablecoin (USDT).
Current Price
This is the prevailing price of the cryptocurrency you plan to buy or sell (base currency) against the quote currency.
Time: X-Axis
The x-axis of the price chart indicates the time period. Price charts are read from left to right, with historical prices on the left and more recent prices on the right.
Candlesticks
Among various types of charts such as bar charts, line charts and point and figure charts, candlestick charts are the most commonly used.
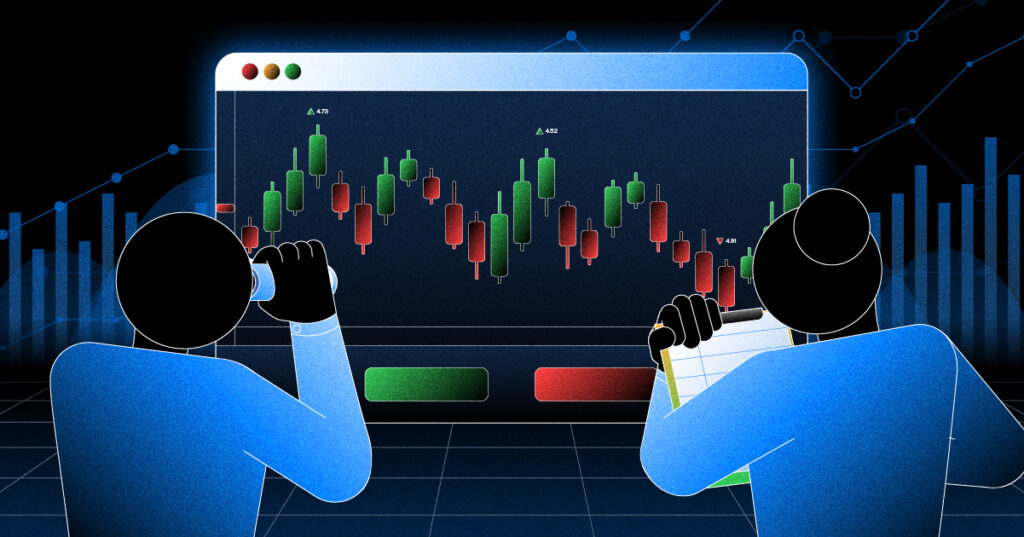
Each candlestick represents the price activity during a specific period that is decided by the user. It can be 1 minute, 1 hour, 1 day, or any other time frame. The formation of a new candlestick on the right side indicates the next period.
There are four important elements in any candlestick: the opening price, closing price, highest price and lowest price. In many crypto charts, green candlesticks indicate when prices closed higher than they opened (bullish), while red candlesticks indicate when prices closed lower than they opened (bearish).
Trading Volume
The trading volume of a cryptocurrency is represented as vertical bars at the bottom of a price chart, which display the amount of cryptocurrency traded within a specific timeframe. The height of the volume bar is indicative of the amount of cryptocurrency traded, with taller bars representing larger trading volumes.
The colour of the bar corresponds to the colour of the candlestick for the same time period. For example, if the candlestick is green, the bar will also be green.
Support and Resistance
Support and resistance are crucial concepts in reading any crypto price chart. Support levels act like price floors, where the asset does not fall below a certain price level for a specific period of time.
In contrast, resistance levels act like price ceilings, where the asset does not rise above a certain price level for a specific period of time.
As you gain more experience trading in the crypto markets, you will realize that support and resistance form the foundation of technical analysis.
Moving Averages
Moving averages are widely used technical indicators in crypto markets. They filter out price volatility, by taking the average price of a cryptocurrency over a period of time, to generate a trend line in the price chart. This trend line is also known as the moving average, which helps traders to determine the trend of the selected crypto and/or market trends.
The 50 and 200-day moving averages are most commonly used by traders. Generally, the market is interpreted to be in an uptrend when prices trade above the 200-day moving average, and in a downtrend when prices trade below it.
There are two types of moving averages; the simple moving average and the exponential moving average.
- Simple moving average (SMA): Calculated by taking the sum of the price of the crypto over a specified number of time periods and dividing it by the number of time periods.
For example, the 200-day simple moving average = Sum of prices over the previous 200 days / 200.
- Exponential moving average (EMA): This is a type of moving average that gives more weight to recent prices. For example, the 200-day weighted moving average gives more weight to recent prices compared to older prices.
Embark on Your Crypto Trading Journey
Learning how to read crypto price charts is essential in cryptocurrency trading. With an understanding of the price charts, you can make informed decisions on when to buy, sell or hold a particular crypto.
With a simple and intuitive layout, the price charts on the Flipster app cater to both new and experienced traders. In addition, when you trade on the Flipster app, you have a selection of over 180+ tokens to trade from and you do not have to pay any trading fees. Download the Flipster app and experience these features today!